Breast Cancer Machine Learning
Published:
======
The machine learning algorithms were trained to detect breast cancer using the Wisconsin Diagnostic Breast Cancer (WDBC) dataset[1] The dataset consists of features which were computed from a digitized image of a fine needle aspirate (FNA) of a breast mass. There are 569 data points in the dataset: 212 – Malignant, 357 –Benign.
The features describe the characteristics of the cell nuclei found in the image including:
- ID number
- Diagnosis (M = malignant, B = benign) 3–32)
Ten features for each cell nucleus:
- radius (mean of distances from center to points on the perimeter)
- texture (standard deviation of gray-scale values)
- perimeter
- area
- smoothness (local variation in radius lengths)
- compactness (perimeter² / area — 1.0)
- concavity (severity of concave portions of the contour)
- concave points (number of concave portions of the contour)
- symmetry
- fractal dimension (“coastline approximation” — 1)
With each feature has 3 information (1) mean, (2) standard error, and (3) “worst” or largest (mean of the three largest values) computed.

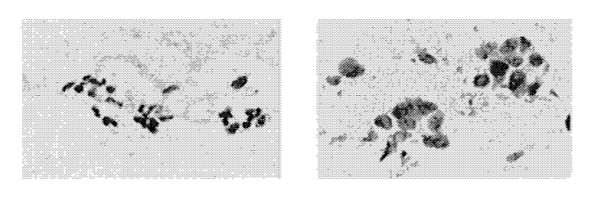
Figure from [1] Digitized images of FNA: (left) Benign, (right) Malignant.
# Objective
This analysis aims to check which parameters or features are the most helpful to predict the diagnosis outcome (Benign or Malignant cancer.
The goal is classify whether the specific cancer is benign or malignant.
I used the classification algorithmn to fir the function that predict the new instances.
Detail analysis and the model for the project can be read here
References:
- William H Wolberg, W Nick Street, and Olvi L Mangasarian. 1992. Breast cancer Wisconsin (diagnostic) data set. UCI Machine Learning Repository (http://archive.ics.uci.edu/ml/)(1992)
